A Guide for Investing in Infrared Cameras
In simple terms, an IR camera or thermal imager converts infrared radiation into a visual image that depicts temperature variations across an object or scene. This allows one to make non-contact measurements of an object’s temperature for data acquisition, analysis, and reporting. The process of using an Infrared camera for data viewing, recording, analysis, and reporting is called Thermography.
Thermography has become an indispensable tool for all sorts of R&D projects. There are a lot of IR camera options available at varying costs and features; so selecting the correct camera that will help solve your particular application is challenging.
To ensure you get a quality IR camera that meets all your application requirements, both now and in the future, FLIR has put together a list of 7 Things to know when selecting an IR camera for Research and Development. This will help guide you through the process of identifying project requirements, and selecting a camera with features best suited for your unique application. This discussion will help you narrow down the wide array of IR cameras by guiding you in the creation of a requirements document, which will point you in the right direction for your ultimate camera selection.
The seven things to know when selecting an IR camera for Research and Development are summarized in the following questions:
1. What temperatures are you expecting to measure?
2. How fast will you need to capture the data?
3. What is the size and distance to your target of interest?
4. What type of detector is best suited for your application?
5. What kinds of temperature analysis and report generation will you need?
6. What additional accessories will you require?
7. What support and training options are available from the camera manufacturer?
Typically the goal of using an IR camera is to measure temperature changes on your object of interest. Two considerations when measuring temperature are the Temperature Range of your object and the Temperature Resolution you wish to achieve. Answering these two questions will help narrow down which infrared cameras and detector types are best suited for your application.
Temperature Range:
Temperature Range is defined by how cold and hot your object will become. This could also be the coldest and hottest temperature in the scene you are viewing. For example you may be imaging an aircraft engine idling on the runway. In this example the body of the aircraft may be at a temperature of around 25°C and the engine at a temperature of around 500°C. So your range would be roughly 25°C to 500°C and you would then look for a camera system that will allow you to image the entire range at one time.
Temperature Resolution:
Temperature Resolution is the smallest temperature difference you need to measure and is commonly referred to as Temperature Sensitivity of the IR Camera. IR camera sensitivities can range from 0.020°C up to 0.075°C, depending on the type of detector of the camera.
Temperature Resolution or sensitivity for IR cameras is commonly expressed as Noise Equivalent Delta Temperature (NEdT). This figure of merit is the smallest temperature change the IR camera can detect above its noise floor. Simply put, this is the smallest temperature change you can measure with that particular camera. Table 1 shows some common Temperature Ranges and Temperature Resolutions of different IR camera types.
| Camera Model | Detector Type | Temp Resolution | Temp Range |
|---|---|---|---|
| A325 | Microbolometer | 0.075ºC | -20º to +120ºC +0 to +350ºC |
| Silver SC5200 | Indium Antimonide | 0.020ºC | -10ºC – 55ºC 10ºC – 90ºC 50ºC – 150ºC 80ºC – 200ºC 150ºC – 350ºC |
| Titanium SC7700L | QWIP | 0.025ºC | -10º to +80ºC +50º to +200ºC +150º to +600ºC +350º to +1500ºC |
From Table 1 you can see that the A325 offers wider Temperature Range but less Temperature Resolution (Temperature Sensitivity); whereas the Silver SC5200 offers much better Temperature Resolution but somewhat smaller overall Temperature Range. (There is a process that allows the Silver to have a wider overall range than the A325, called Superframing, which will be covered further in Point #5.) As you can see there are a lot of options, but defining your temperature range and resolution will help initially narrow down which camera solutions will meet your application requirements.
Note: Temperature Resolution (Sensitivity) is not the same as the Temperature Accuracy of the IR camera. Rather, temperature accuracy is the ability of the camera to accurately measure an object’s exact temperature. To help explain, imagine we were looking at a hot mug of coffee which is 90°C but then cools off to 89°C. A camera with good sensitivity will detect the temperature change easily. But if the camera was not calibrated correctly it may think the temperature started at 91°C and dropped to 90°C; therefore its accuracy is roughly +/-1°C in this example.
When answering this question there are three things to consider: Exposure Time, Frame Rate, and Total Record Time.
Exposure Time
Exposure time is how quickly an IR camera can capture a single frame of data, which is similar to shutter speed on a traditional visible light camera. The exposure time for IR cameras is referred to as Integration Time, or the detector’s Thermal Time Constant. These two terms simply refer to the amount of time it takes to capture a single thermal image.
Let’s explore the analogue of the IR camera’s exposure time, i.e., a traditional camera’s exposure time with respect to the advantages of longer and shorter exposures. For both cameras, the shorter the exposure time, the less likely there will be blurring for high speed events. However, since the exposure is shorter there is less time for the cameras to image the target; so you may be under-exposed. On the other hand, longer exposure times allow you to collect more light (for the traditional camera) or heat energy (for the IR camera) from your object of interest. The drawback of course is that if your target is moving fast you may see blurring.
So there is a tradeoff between short and long exposure times. But if we remember from Table 1 that some cameras have better Thermal Resolution and therefore are more sensitive. We can deduce that it requires less exposure time for the higher sensitivity cameras to get the same image as the lower sensitivity cameras when looking at the same thermal target. For cameras that have these better Thermal Resolution detectors you get the best of both worlds – good imagery of cooler objects and no motion blur.
To determine if a particular IR camera will meet the speed requirement of your application you will need to consider:
• The motion of your target object
• How quickly/slowly your target object will heat up or cool down
• The motion of the IR camera
Frame Rate (frames/second)
A camera system’s frame rate describes how many thermal images per second you can collect from the IR camera. IR camera systems with fast frame rates allow you to capture the thermal signatures of fast moving targets, such as ballistic projectiles or explosion scenes. If data acquisition is fast enough, it’s even possible to capture a sequence and play it back in slow motion. So, the higher the camera’s frame rate, the better the results for dynamically changing targets.
As you would imagine, shorter Exposure Times allow for faster frame rates. Thermal cameras have frame rates that vary from a few frames per second to thousands of frames per second. Here is Table 1 again with an added column showing frame rates:
| Camera Model | Detector Type | Exposure Times | Frame Rate |
|---|---|---|---|
| A325 | Microbolometer | 12 milliseconds | 60 fps |
| Silver SC5200 | Indium Antimonide | 1.0 milliseconds | 170 fps |
| Titanium SC7700L | QWIP | 16 milliseconds | 380 fps |
Total Record Time
Do you plan on capturing data at high speed for long time periods, high speed for short bursts of data, or data log at slow rates for hours? There are as many data recording options as there are cameras; so all data collection scenarios should be explored to determine the type of IR recording system you will need.
Certain IR cameras like the SC660 have built in storage capabilities where they can record to internal FLASH memory, or a removable Compact SD card. Other cameras such as the Silver SC5000 and Titanium SC7000 stream the high speed thermal data over Gigabit Ethernet or CameraLink to a PC or laptop for recording. For high speed extended length recording there are solutions where the data is streamed to a RAID array of disks that can handle the fast frame rates and feature large amounts of disk space to record for long time durations.
Therefore, based on the Frame Rate and Total Record Time you can figure out what camera and data system option will work best for your application.
To get the best thermal imagery and most points of measurement on your thermal object of interest, you should select a lens that fills the Field of View with the target of interest. At the same time, you typically want to optimize your Spatial Resolution to make sure the smallest object detail you need to see matches your Instantaneous Field of View.
Spatial Resolution
Spatial Resolution is the same as Instantaneous Field of View (IFoV). Both are the smallest physical detail you can detect on your target and are based on the smallest area a single camera (detector) pixel covers. The closer you are to an object the smaller the area a pixel will detect and as you move farther away the area becomes larger. (see Figure 1)

Field of View (FoV)
As you’ll notice the Field of View also changes as you view objects from farther away. Similar to Spatial Resolution, this means you will have less pixels on a target from a distance than you will from close up. Ideally you want the object to fill the Field of View, but sometimes this is not possible due to the heat of the target and the danger it could pose for the camera or the operator.
Once you have defined the desired Field of View and Spatial Resolution you can select the best lens or set of lenses for your application. The math required to determine these values by hand can be daunting, so FLIR has developed a free online Field of View calculator to assist you with this process (www.flir.com/thg/calculator). To use the online tool you simply enter the object size, distance to the object, and prospective lens. The calculator will compute the Field of View, Spatial Resolution, and number of pixels on the object of interest, making the lens selection process very easy.
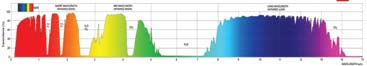
In Section 1 of this guide an explanation was offered as to how temperature measurement sensitivity varies based on the IR Camera’s detector type. An additional point to consider is that different detector technologies sense infrared energy in different wavelengths or wavebands. Depending on your application, the waveband over which the IR Camera senses energy can have a significant impact on measurement results.
If you look at Figure 2, you’ll see a typical atmospheric IR transmission curve. According to the figure, there is good IR transmission through the atmosphere at 7.5um to 13.0um and 3.0um to 5.0um. Thus, if your application requires you to look long distances through the atmosphere, then choosing detectors that operate in these transmission windows is optimal.
Other applications that involve looking at or through materials follow a similar logic. What if you wanted to measure the temperature of a lightbulb’s filament, for example? You’d have to look through the bulb’s outer layer of glass to do so.
Figure 3 shows the transmission curve for the bulb’s glass, which shows a spectral window that allows for IR transmission. A camera that senses in the 3.0um to 4.1um waveband will be required to see through the glass and measure the filament.
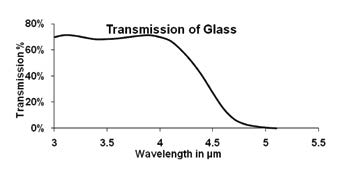
Figure 4 shows what happens when a camera senses within the glass transmission window and looks at the lightbulb. This thermogram demonstrates how a camera with an InSb detector can view and measure the temperature of a lightbulb filament.
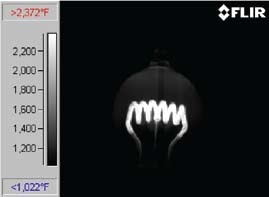
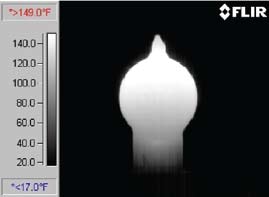
Figure 5 shows what happens when you look at the lightbulb through a camera that is located outside the glass transmission window. The camera clearly allows you to see and measure the bulb’s glass surface temperature, rather than the filament inside the glass, as shown in Figure 5.
To summarize, for certain applications looking through materials may guide you to a specific detector based on its unique spectral waveband response.
Up to this point, we’ve primarily focused on infrared camera hardware and data collection considerations, but this is only half of a system solution. The other half, Data Analysis and Report Generation, is frequently overlooked (data sharing). This section focuses on defining what data analysis is required for specific applications and what data sharing methods are available with colleagues and customers.
Data Analysis
Temperature values in degrees Kelvin, Farenheit, and Celsius are provided for each pixel by FLIR’s temperature calibrated IR cameras. The image can be displayed to quickly see where hot and cold spots are on your unit under test. Image enhancement, image subtraction, emissivity adjustment, and chart and graph plotting techniques, on the other hand, can be even more useful in helping someone truly understand the thermal changes occurring on a target object.
Image Enhancement is the most basic tool used in Thermography to adjust the Level and Span of the image color palette. This allows you to enhance the image while also highlighting the subtle temperature differences.
Furthermore, software that allows you to subtract a baseline image from the energized image allows you to remove any reflected ambient temperatures and reveal extremely small temperature differences. For objects that are reflective or have a low emissivity, this technique is essential.
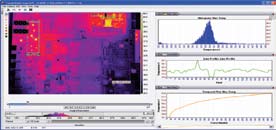
Data can also be plotted in charts or graphs using other useful tools. Histogram graphs, Line Profile graphs, and Temperature vs. Time charts are some examples.
These graphs and charts aid in the identification of the target heat distribution and temperature changes over time.
All of these analysis tools are illustrated in Figure 6.
Report generation and data sharing are two other aspects of thermography that are frequently overlooked. The data collected and analyzed during an R&D project will be shared with others at some point. You might want to share raw data with colleagues for further analysis or analysis results with customers, for example. As a result, it’s critical to understand who you’ll be sharing data with and what format they require in order to make the most of your findings.
Custom data analysis using third-party software such as MatLab or Excel is often desired. For use in Excel or Matlab, having an IR software package that allows data export in a Comma Separated Value (CSV) file is ideal. Similarly, data collected over a long period of time is best shared as a data log file, which can be exported as a text file or spreadsheet. This is also great for importing into third-party software for further analysis.
Static images or movie files that can be inserted in emails, slide presentations, or word processor documents will best illustrate IR analysis results for management and customers. So, for static imagery, the ability to export IR sequences and images as JPEG or BMP files is required, as is the ability to export movies as AVI or WMV.
Superframing:
We briefly mentioned Superframing in Section #1 as a way to expand the Silver camera’s overall temperature range. Superframing entails cycling the infrared camera through up to four different temperature ranges and capturing data from each one in turn. The data can then be presented as separate movie files (one for each temperature range) or combined into a single extended temperature range Superframe movie using software like FLIR’s AltaIR. Only certain cameras and software are compatible with superframing. For more information on Superframing, see FLIR’s “The Ultimate Infrared Handbook for R&D Professionals,” available at www.go.flir.com/rdhb1.
The project’s overall requirements may include more than just the Infrared camera and software. For example, your camera may be required to be placed in an enclosed environment. Alternatively, the camera could be located hundreds of miles away from the operator, necessitating remote control. In situations like these, it’s a good idea to look for an IR camera provider that offers turn-key solutions with optional accessories.
You might want to consider an enclosure with a special infrared window that is optimized for that particular camera and detector if you want to mount the camera outdoors or in a manufacturing environment. Another factor to consider is whether the camera will be looking through a special infrared window into an environmental chamber or other pressurized enclosure. In both of these cases, you’ll want to choose a window with good transmission for the detector’s sensitivity waveband and anti-reflective coatings. FLIR has tools to help you figure out what type, size, and thickness of material is best for your needs. Most FLIR cameras come with off-the-shelf enclosures, allowing for a true out-of-the-box solution. (See Illustration 7.)

Cable extensions are another common accessory for situations where the camera is located far away from the camera operator. If the camera is mounted on a tracking mount near a test that is considered too dangerous for humans, for example. In this case, Ethernet, Firewire, or CameraLink to fiberoptic extenders can be used to send thermal data at full frame rates over long distances if needed. FLIR has solutions for these situations as well, saving you time and money while eliminating the guesswork involved in putting together an integrated test system.
When building the final thermography system, there are many additional considerations for optional accessories; be sure to consider the test environment when defining your infrared system requirements, and keep track of what accessories might be useful. FLIR is dedicated to helping you solve these problems with a broad range of products and information from third-party sources, whether it’s the availability of appropriate optics, extended cable lengths, a camera stand, enclosure, or a data system.
When looking for an infrared camera, this is often overlooked. IR cameras, like other advanced instruments, offer a wide range of capabilities. When it comes to getting the most out of your camera system investment, application and other factory support become critical. Support can range from providing delivery information on an order to describing temperature measurement techniques on reflective targets. When things don’t go as planned, when repairs are needed, and when training sessions are required, FLIR is always there.
For example, our education and training capabilities
include:
• Organized training available in the form of classes – formalized training of camera usage, software, and data collection systems; application techniques; physics of radiometry and thermography
• Training at the manufacture facility – you’re able to interface with those who engineer, build, and service camera systems.
• Regional training – nearby to reduce travel.
• Customer site training – training provided at the customer site location for more application specific training.
In addition, customers who purchase directly from FLIR
benefit from:
• Access to engineers who are thermography experts.
• Direct flow of information – upgrades, new releases, education, etc…
• Dedication and focus – FLIR focuses on one thing: infrared imaging and measurement.
Copyright © 2024 Butler & Land Technologies, LLC. All Rights Reserved.
Web Design by Red Spot Design. Return & Refund Policy, Terms & Conditions